Data Analyst vs. UX Designer: A Second-Career Comparison
One path rewards pattern-finding in spreadsheets and code, the other rewards talking to users and sketching screens — here is how to tell which is yours.
Quick answer
- Pay favours data: a median of $120,230 for data scientists in May 2025 against $104,000 for web and digital interface designers (U.S. Bureau of Labor Statistics, 2025).
- Credential flexibility favours UX: 44% of O*NET survey respondents said a master's was required for new data scientist hires, against 30% naming a post-baccalaureate certificate for designers (National Center for O*NET Development, undated).
- Sitting is slightly lower in UX: 76% of respondents said data scientists sit continually, versus 69% for designers (National Center for O*NET Development, undated).
Both are desk careers built on a portfolio, both are commonly entered in your forties or fifties, and both sit in the same preparation tier: ONET places Data Scientists and Web and Digital Interface Designers in Job Zone Four, "Considerable Preparation Needed" (National Center for ONET Development, undated). Data pays more at the median — $120,230 for data scientists in May 2025 against $104,000 for web and digital interface designers (U.S. Bureau of Labor Statistics, 2025) — while design is more forgiving about credentials.
Plan on 12 to 24 months from first course to first paid role if you are studying around a full-time job.
Side-by-Side Comparison
Federal data tracks data scientists for analytics work and web and digital interface designers for UX. Posted titles vary by employer — "data analyst," "BI analyst," "product designer" — but the patterns below are the right ballpark.
| Dimension | Data analyst | UX designer |
|---|---|---|
| Median pay, May 2025 | $120,230 for data scientists (U.S. Bureau of Labor Statistics, 2025) | $104,000 for web and digital interface designers (U.S. Bureau of Labor Statistics, 2025) |
| Typical entry education | Bachelor's degree, no related work experience needed to enter (U.S. Bureau of Labor Statistics, 2025) | High school diploma through bachelor's; employers may hire on prior work or projects without specific credentials (U.S. Bureau of Labor Statistics, 2025) |
| What survey respondents said is required | 48% bachelor's, 44% master's, 4% associate's (National Center for O*NET Development, undated) | 52% bachelor's, 30% post-baccalaureate certificate, 16% associate's (National Center for O*NET Development, undated) |
| Preparation tier | Job Zone Four, SVP 7.0 to <8.0 (National Center for O*NET Development, undated) | Job Zone Four, SVP 7.0 to <8.0 — the same tier |
| Transition time while working | 12–24 months; the Google Data Analytics Professional Certificate is listed as completable in under 10 hours a week in less than 6 months (Coursera, undated), with the rest on portfolio and job search | 12–24 months, weighted toward three or four case studies rather than coursework |
| Schedule and physical demand | 76% sit continually or almost continually (National Center for O*NET Development, undated); spikes at reporting cycles | 69% sit continually or almost continually (National Center for O*NET Development, undated); more meetings and research sessions |
| Typical starting age for switchers | No age criterion for entry; switchers commonly arrive in their 30s to 50s | Same, and portfolio-led hiring makes late entry more common |
Pay varies sharply by state, metro and employer, and first roles normally sit below these medians, which include experienced workers. Check your state's figures on the Bureau of Labor Statistics occupational pages before budgeting.
What Each Job Looks Like Day to Day
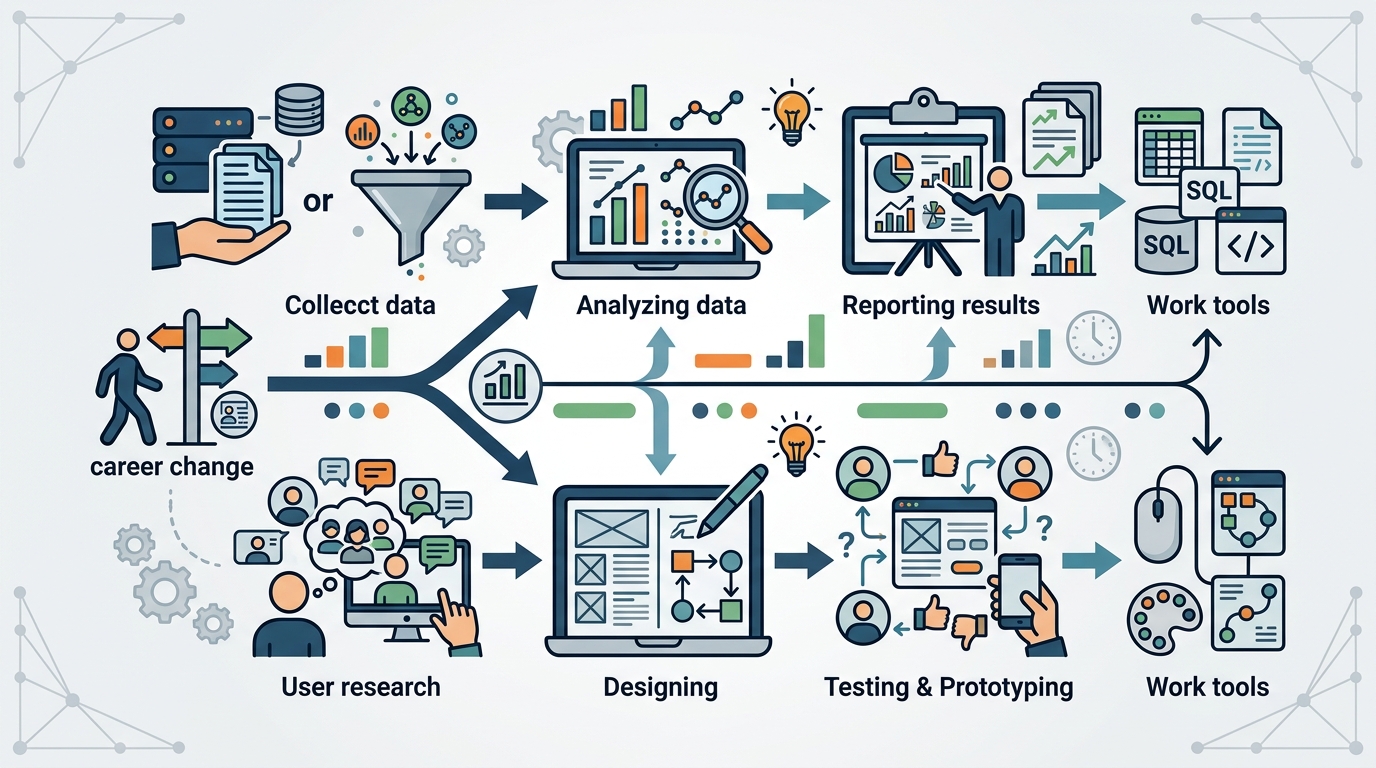
As an analyst, you spend the morning working out which data are available and useful for a question someone asked, then collecting and categorising it — often pulling tables with SQL and cleaning them before anything can be charted. The afternoon goes on building, validating or updating a model, then turning the result into a visual a non-technical manager can act on. The output is usually a recommendation; the Bureau of Labor Statistics describes data scientists as making business recommendations based on their analysis (2025). Expect long uninterrupted screen time and pressure around month-end reporting.
As a UX designer, you start with people rather than tables. A typical day includes meeting clients or management to discuss what the product needs to do, then turning that into prototypes and mockups — wireframes, a clickable checkout flow, a rewritten navigation menu. You then test the interface, watch users stumble, and revise. Depending on the employer you may also write code or integrate graphics, audio and video (U.S. Bureau of Labor Statistics, 2025). Still desk-based, but broken up by research sessions and stakeholder reviews.
Which Fits Your Background
- Accountant, bookkeeper or insurance underwriter — data analyst. You already reason about reconciliation and what a number means when it looks wrong; SQL and Python are the missing layer, not the thinking.
- Retail or restaurant manager — UX designer uses more of what you have. Years of watching customers get confused at a counter is user research; you need to learn to document it.
- Elementary or secondary teacher — UX designer. Lesson sequencing, spotting where someone gets stuck and explaining a change to a sceptical room are the core of design work.
- Registered nurse or lab technician — data analyst. Protocols, measurement error and record systems transfer, and healthcare analytics teams value people who know what the data describe.
- Graphic designer, architect or print production artist — UX designer, and the shorter route of the two. Add interaction patterns and usability testing, and reframe the portfolio around problems solved.
- Career changer aged 45 to 60 worried about screening — lean UX if the worry is credentials: employers may hire web developers and digital designers who demonstrate ability through prior work or projects without specific credentials (U.S. Bureau of Labor Statistics, 2025). On the data side, counter the 44% of respondents who said a master's is required (National Center for O*NET Development, undated) by targeting analyst rather than data scientist titles.
- Military or federal service leaver — data analyst, especially from a logistics or intelligence role. Process discipline transfers; the gap is tooling.
How to Decide and Test the Waters
- Spend four weekends on each. Rebuild one spreadsheet you already own as a dashboard. Then redesign one screen of an app you use daily and write 300 words on why. Notice which you keep doing.
- Shadow two people. Ask one analyst and one designer for 45 minutes watching them work, not a coffee chat. A design critique versus a data cleaning session settles more than any syllabus.
- Take one structured programme in the direction you leaned. The Google Data Analytics Professional Certificate is listed as completable in under 10 hours a week in less than 6 months (Coursera, undated). On the UX side, put the same hours into three case studies, since designers are hired on demonstrated work.
- Do real work before you quit. Analyse donation or attendance data for a nonprofit, or redesign a small organisation's booking flow. One shipped project with a named client beats five exercises.
- Move internally first. Ask for reporting or design tasks in your current job — the best way to shorten the 12–24 month transition and avoid an income gap.
- Price the switch. Budget the certificate or bootcamp fee, software subscriptions, and the likelihood that a first role pays below the medians above. Many switchers plan for 6 to 18 months of reduced or interrupted income. Confirm tuition with the provider and pay for your state with the Bureau of Labor Statistics.
Frequently asked questions
Which career is faster to enter if I am starting at 50?
UX design, usually, because the entry bar is credential-light: employers may hire web developers and digital designers who demonstrate ability through prior work or projects (U.S. Bureau of Labor Statistics, 2025), and 30% of O*NET respondents named a post-baccalaureate certificate for new designer hires, against 44% who said a master's was required for data scientists (National Center for O*NET Development, undated). Both realistically take 12–24 months from first course to first offer around a job.
Will I take a pay cut either way?
Probably at first, in both. The May 2025 medians — $120,230 for data scientists and $104,000 for web and digital interface designers, with the wider web developers and digital designers group at $99,520 (U.S. Bureau of Labor Statistics, 2025) — describe experienced workers. Plan for 6 to 18 months of reduced or interrupted income. Data has the higher median of the two; design usually gets you hired sooner.
Is one of them less of a desk job?
Barely. 76% of O*NET respondents said data scientists sit continually or almost continually, against 69% for web and digital interface designers (National Center for O*NET Development, undated). Design breaks the sitting up with client meetings and usability sessions; analysis runs in longer blocks with crunch at reporting deadlines. Neither suits someone leaving a job to be on their feet.
Sources
- U.S. Bureau of Labor Statistics — Data Scientists : Occupational Outlook Handbook (2025)
- U.S. Bureau of Labor Statistics — Web Developers and Digital Designers : Occupational Outlook Handbook (2025)

Written by
Marisol steers Jobladderhq's coverage of hiring trends and the strange rituals of modern recruiting. She's drawn to the gap between what job ads promise and what the work actually feels like. Her editing hand favors clarity over jargon, always.